Two days ago, we highlighted the brand-new maps which are included in the revised Pictorial Library of Bible Lands. Today, we will illustrate some of the steps involved in creating the maps.
The key to making a map is layers. One layer contains all the dots and names of sites; another layer includes rivers and wadis; the terrain is yet another layer; and so forth. Each of these layers of data has first to be created or obtained from somewhere, and then they are compiled into a map.
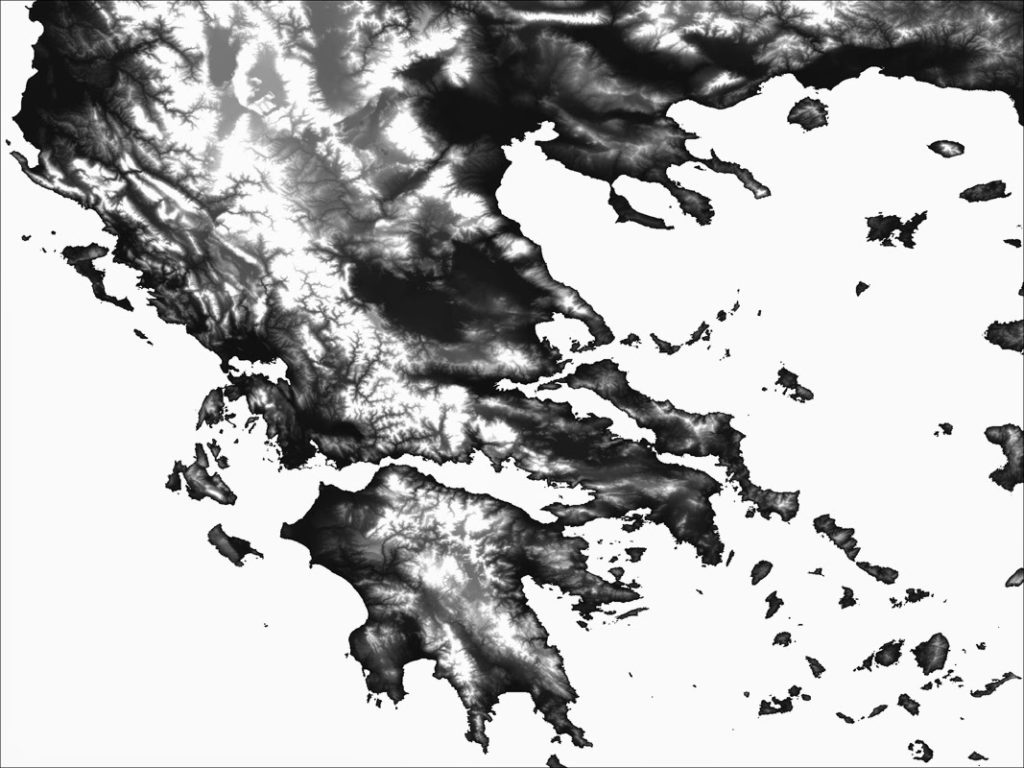
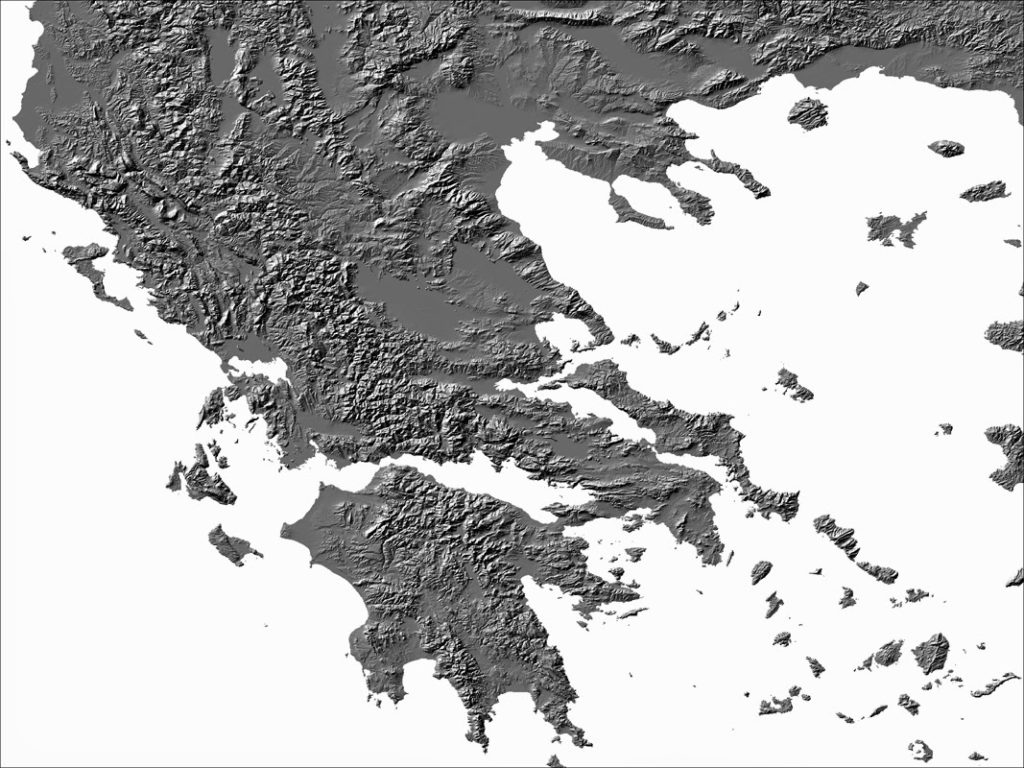
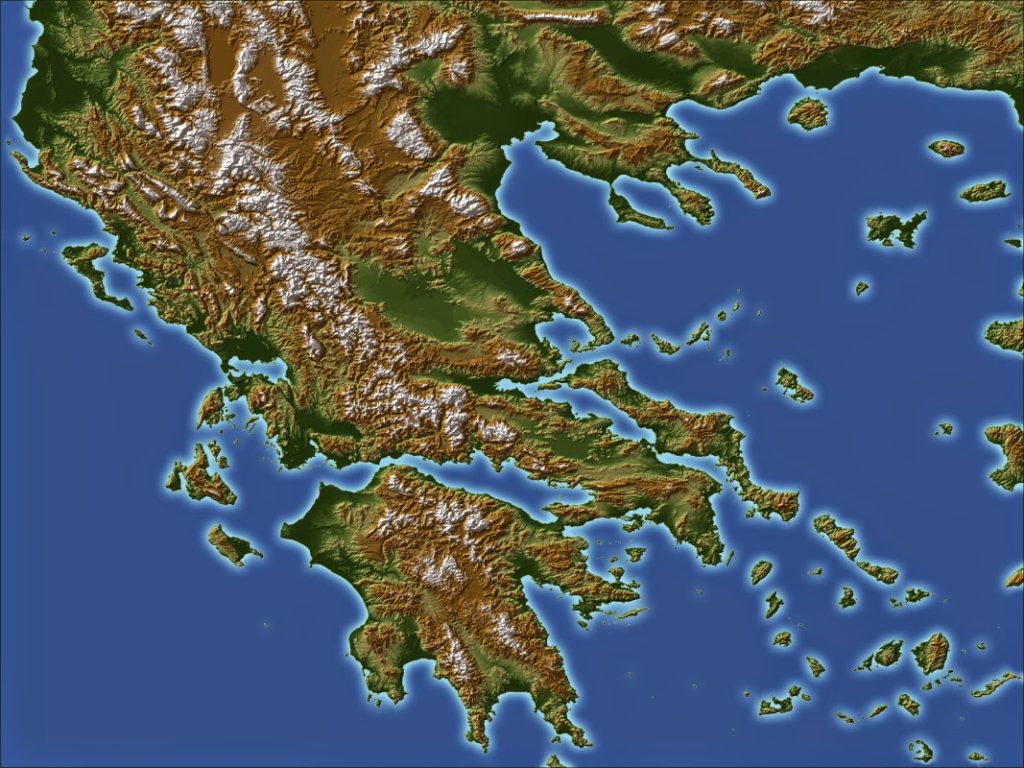
The base maps are created from a DEM, or digital elevation model. A DEM is like a digital photograph from your camera, except each pixel records an elevation. (In this case, the DEMs come from NASA.) From this one DEM, two separate images are generated: one image which shows a continuous color gradation from dark-to-light (showing elevation change), and a second image which shows “hillshading,” that is, the shadows that would be cast if the sun were in a particular position.
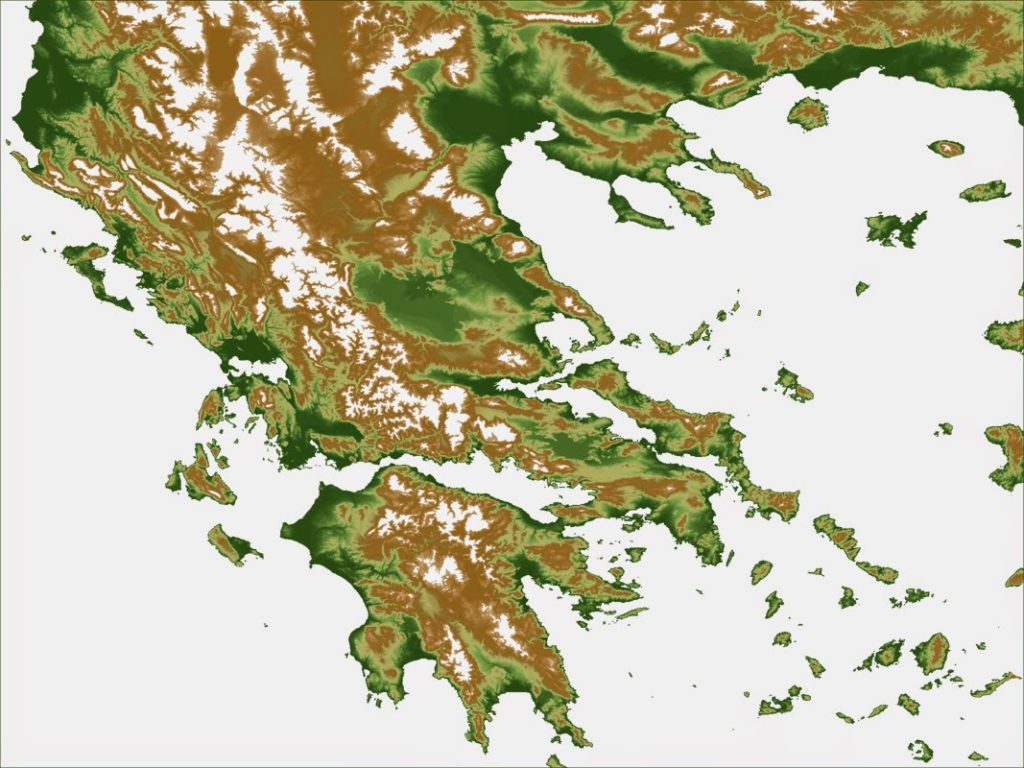
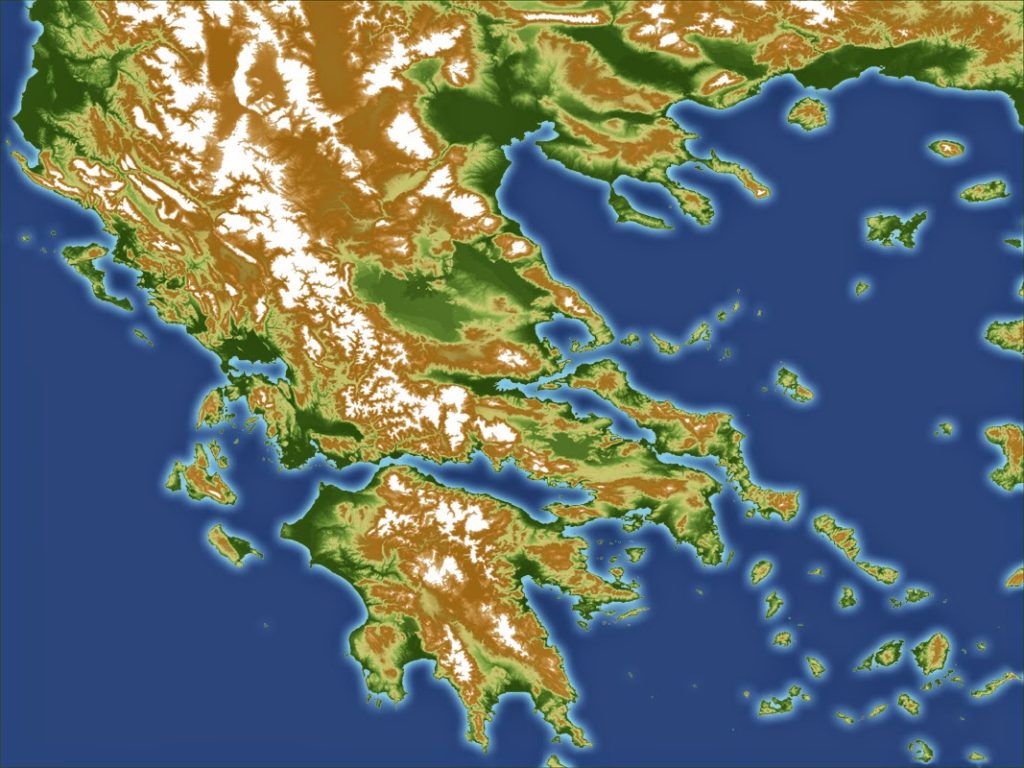
The first image was colorized according to the scheme used for the Pictorial Library maps. Then, the sea was colored blue.
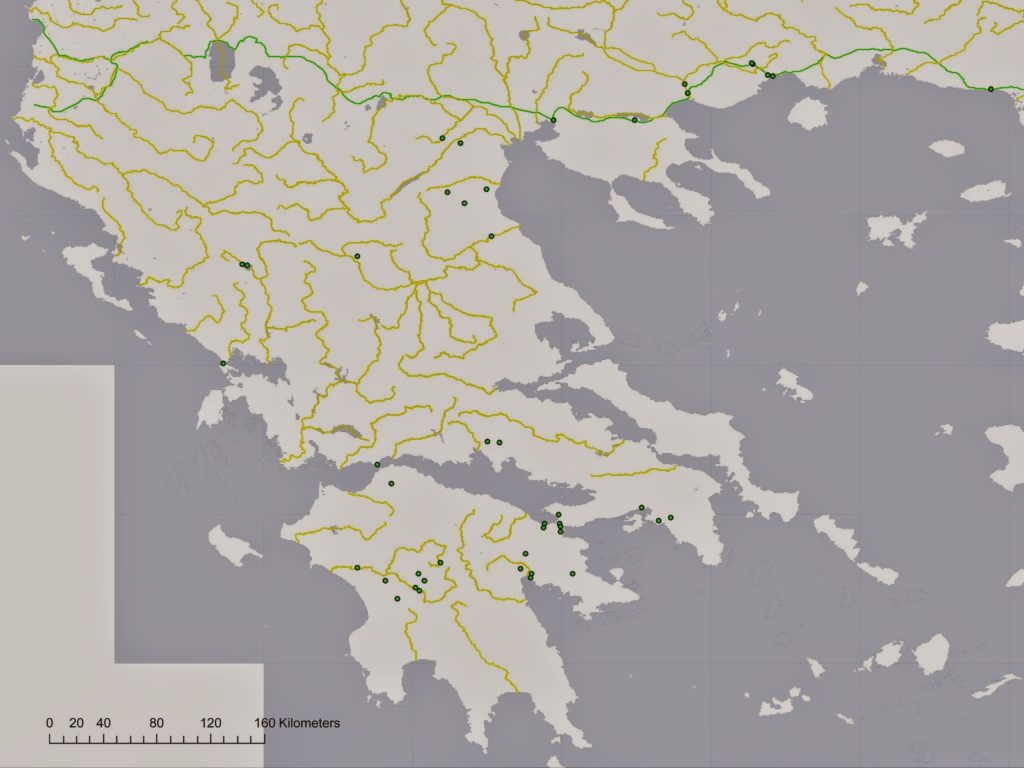
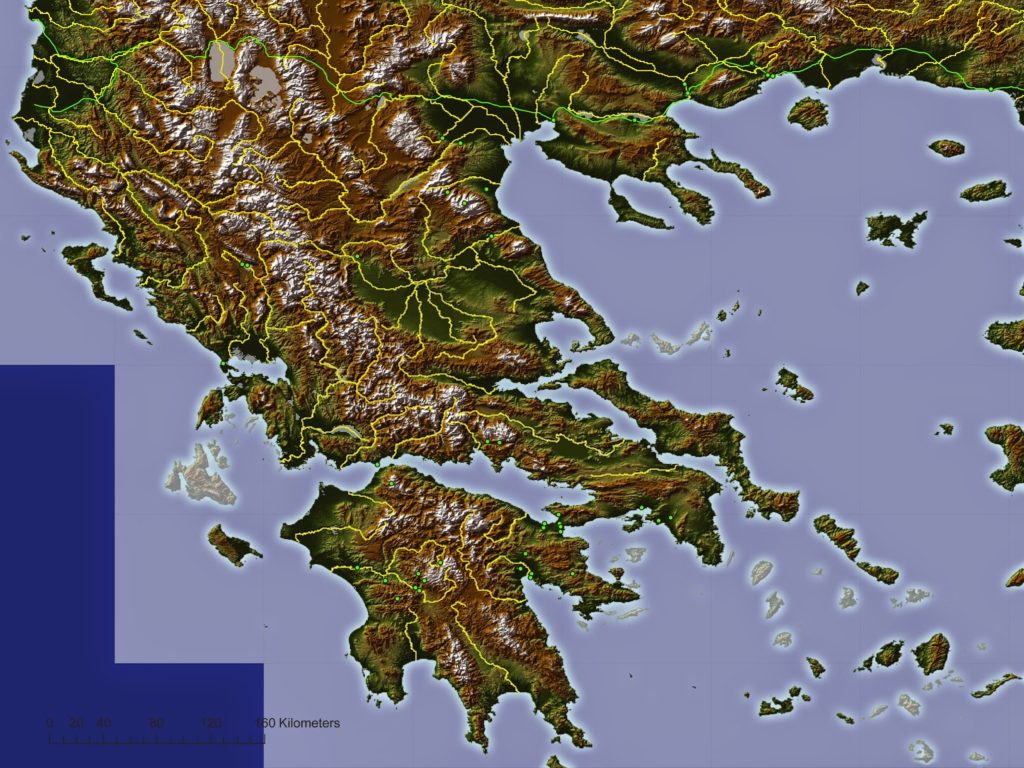
After the base map is completed, it remains to add all the streams, lakes, sites, and other lines and dots that make up the map. The linework and dots began by looking like this.
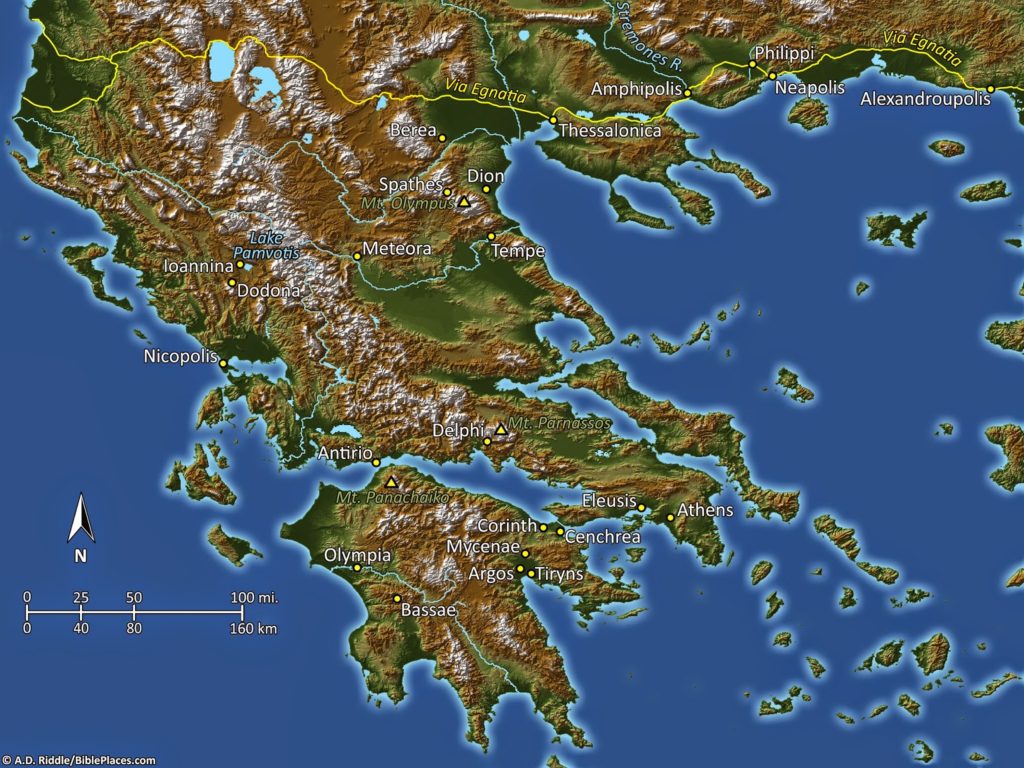
The final step is to “clean up” all the lines and dots and add name labels. The linework is given the right colors, widths and sizes, and any unnecessary elements are removed. The final map comes out like this.
The Jerusalem maps are special. The base map that was used comes from the Ordnance Survey of Jerusalem, by Sir Charles Wilson. The map was scanned, and then colorized by Bill Schlegel. We added the pools, lines and labels.
The Missing Map
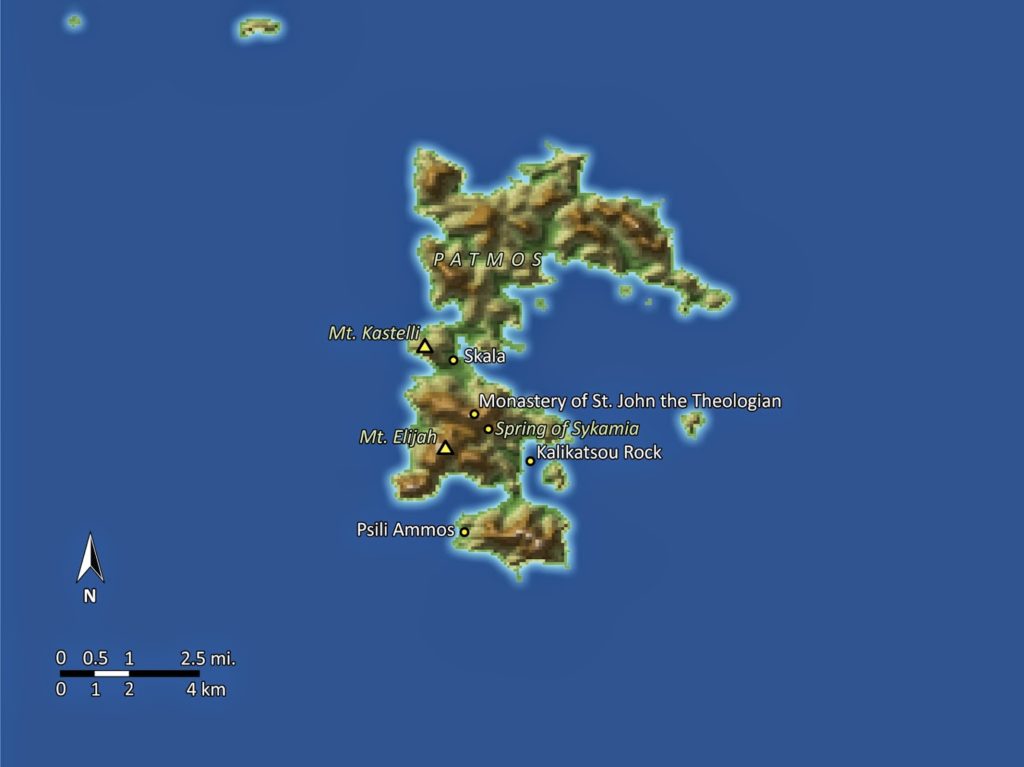
As a final note, when the revised Pictorial Library of Bible Lands was first released, we were not able to include a map of the island of Patmos, because the resolution of the NASA data was too coarse–the island is simply too small. Here is what it would have looked like.
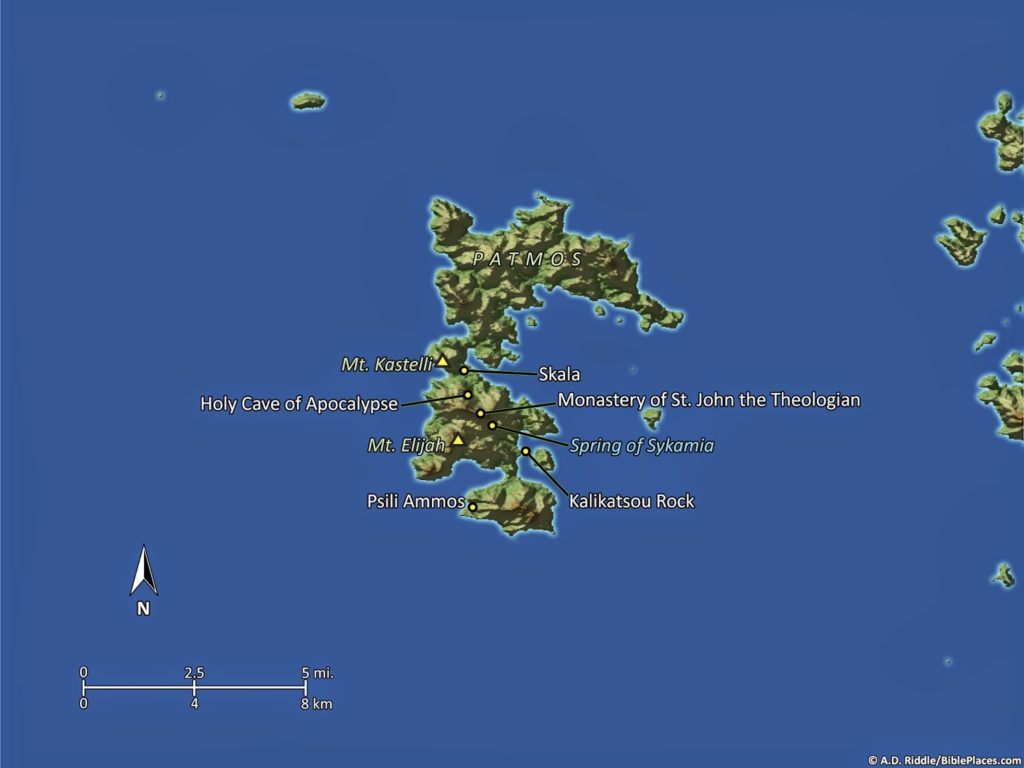
Since then, we have obtained higher resolution DEMs from NASA (via the Oriental Institute’s CAMEL Lab). The resultant map looks much better and now is fit to be included in the PowerPoint for Patmos, in Volume 12 “The Greek Islands” of the Pictorial Library.
In our next post, we will highlight another brand-new feature which was added in the revised edition of Pictorial Library of Bible Lands. As with the maps, it makes the thousands of photographs in the collection more accessible and enhances their usability.
5 thoughts on “Pictorial Library New Features: Maps (Part 2)”
So, is there an "upgrade" for us who presently have the entire Pictoral Library? Thanks, Jerry
Jerry – yes. See this page:
http://www.bibleplaces.com/why-upgrade-revised.htm
And the link (button) at the bottom. In short, you get full credit for your previous purchase. Owners of the 10 volume set get a reduction of about $200 on purchase of the 18-volume set.
Love the maps. Way to go AD!
Thanks for the upgrade link . . . done! Looking forward to the great resources!
Is it possible to buy just the maps from the complete Pictorial Library?
I am not sure that my computer would have enough storage for all the photos.
I am interested in the maps especially as some years back I started doing something similar with the SRTM data – but lost it all with a computer crash.